Monitoring a Ubiquiti NanoBridge with Zabbix
I have a couple of point-to-point WiFi links. One of these uses a 5 GHz NanoBridge, the other a 900 MHz Loco M900. The web interface on these has all kinds of interesting statistics that I would like to get into my Zabbix server for logging and graphing.
The good news is that these devices support SNMP and also at least part of Mikrotik’s “experimental” SNMP module. This means if you do a walk over enterprises.14988 you get 7 OIDs containing interesting information about each connected client. Remember to turn on the SNMP service on the Ubiquiti router first.
$ snmpwalk -v 1 -c public 192.168.2.101 enterprises.14988
SNMPv2-SMI::enterprises.14988.1.1.1.2.1.3.36.164.60.52.42.149.5 = INTEGER: -83
SNMPv2-SMI::enterprises.14988.1.1.1.2.1.4.36.164.60.52.42.149.5 = Counter32: 40677090
SNMPv2-SMI::enterprises.14988.1.1.1.2.1.5.36.164.60.52.42.149.5 = Counter32: 1448775174
SNMPv2-SMI::enterprises.14988.1.1.1.2.1.6.36.164.60.52.42.149.5 = Counter32: 3
SNMPv2-SMI::enterprises.14988.1.1.1.2.1.7.36.164.60.52.42.149.5 = Counter32: 995211
SNMPv2-SMI::enterprises.14988.1.1.1.2.1.8.36.164.60.52.42.149.5 = Gauge32: 6000000
SNMPv2-SMI::enterprises.14988.1.1.1.2.1.9.36.164.60.52.42.149.5 = Gauge32: 26000000
Picking this apart, enterprises.14988.1.1.1.2.1 is the common prefix.
.3— signal strength in dBm.4— transmitted bytes.5— received bytes.6— ?.7— received packets.8— transmit capacity in bits per second (“TX rate” on the interface).9— receive capacity in bits per second (“RX rate” on the interface)
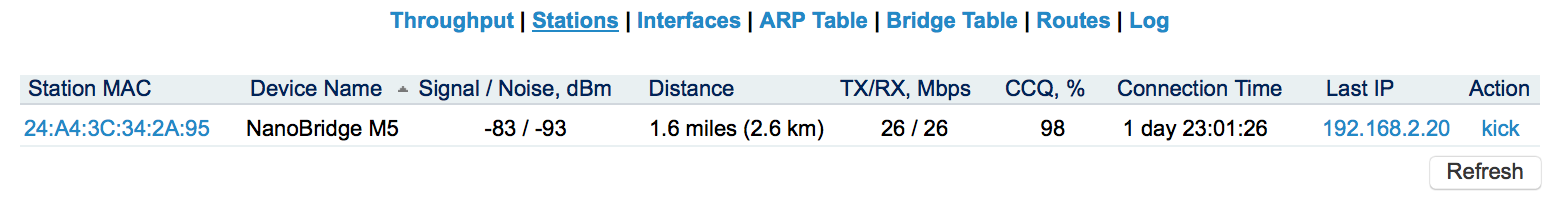
Following that we have the MAC address of the connected client. This client has the address 24:A4:3C:34:2A:95. “36” is “24” in decimal, and so on. This seems like a pretty clever way to avoid OIDs clashing as clients connect and disconnect.
Finally we have a suffix .5.
The bad news is that Zabbix low-level SNMP discovery does not appear to cope with this situation very well. You and I can easily see that each one of those MAC address blocks represents a client. The example in the Zabbix documentation suggests that we need some OID that provides a mapping of index numbers to names. This is pretty good for switches and the like. We don’t have one here so I don’t think we can use discovery. (Perhaps I’m wrong but I’ve hit a dead end for now. See note at the bottom about alternatives.)
All is not lost, though. If we know which client(s) are going to be connected to a particular AP we can use macros to specify the particular MAC address. That is, for each Zabbix “Host” (Ubiquiti router) we will add a macro {$MAC_OID} containing a partial OID like 36.164.60.52.42.149. We can create a NanoBridge template that uses this macro and assumes it will be present for any Host it is linked to.
This is what my template looks like. Download XML
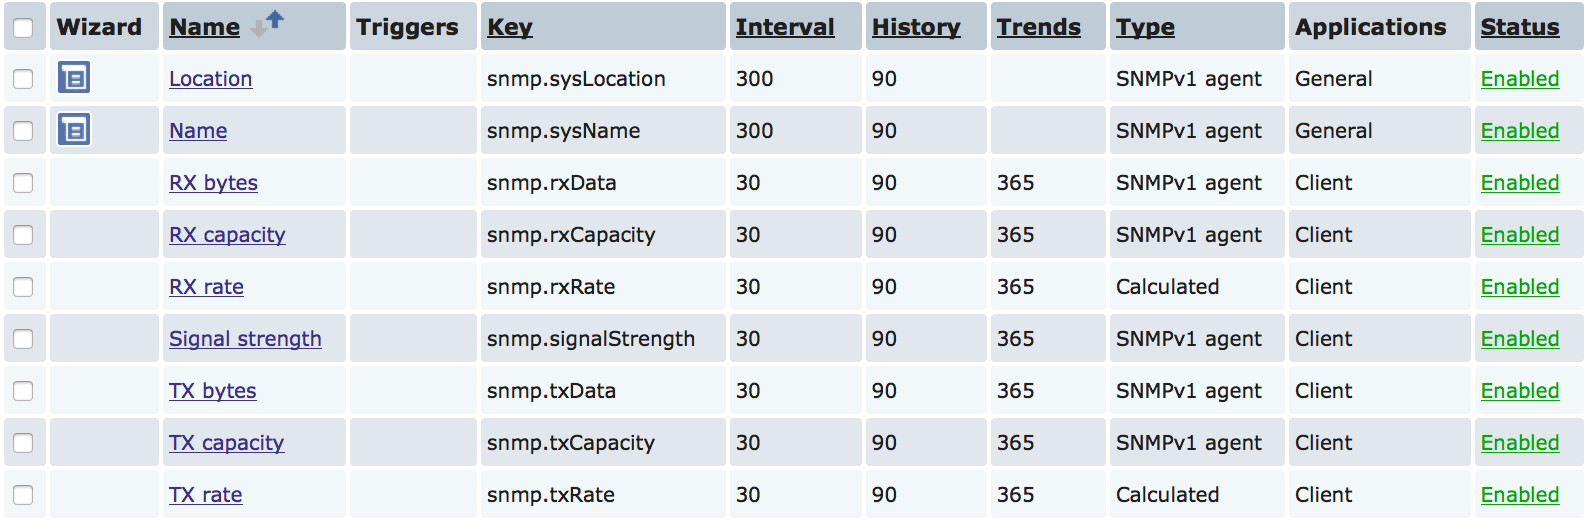
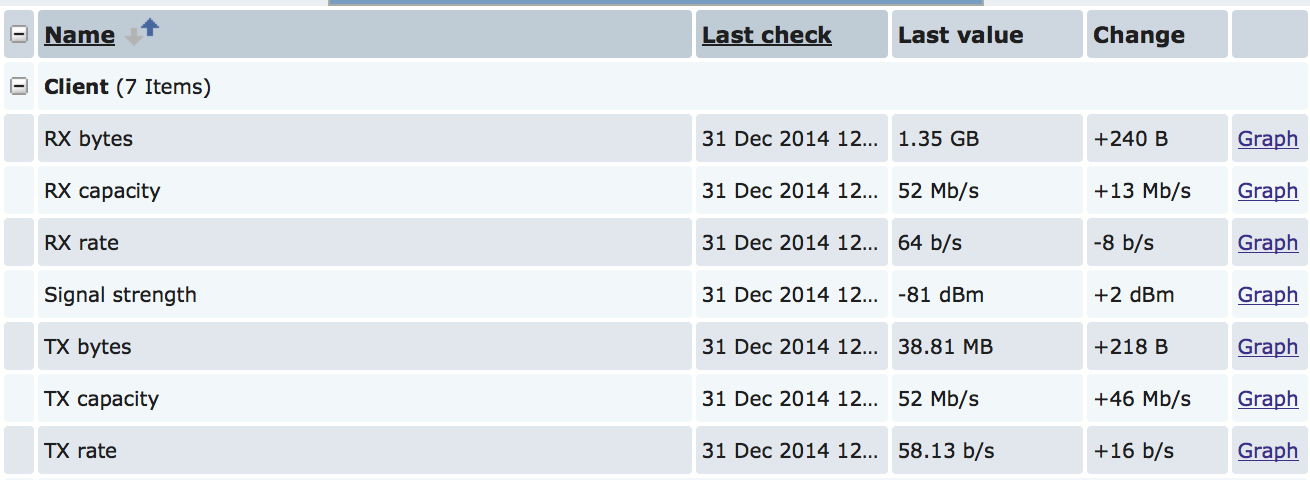
We have five of the fields described above and two calculated fields to show how much data was transmitted and received per second. I also pulled out two general pieces of information so I don’t get confused:
sysName.0—.1.3.6.1.2.1.1.5.0— router hostnamesysLocation.0—.1.3.6.1.2.1.1.6.0— router location
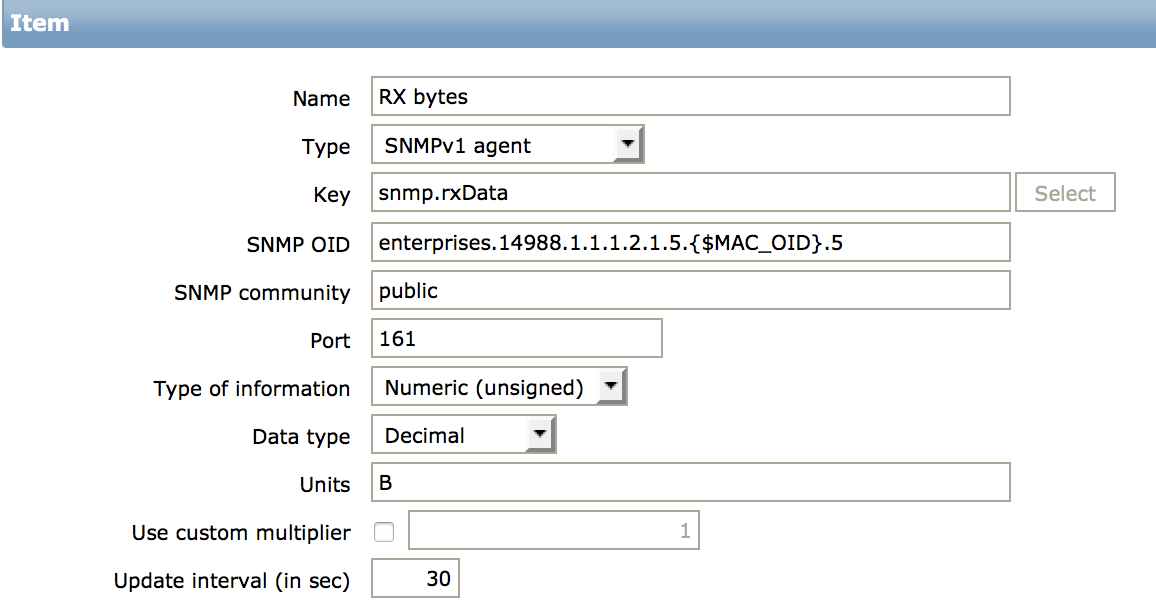
This is what the client-specific Items look like with the macro inserted inside the OID.
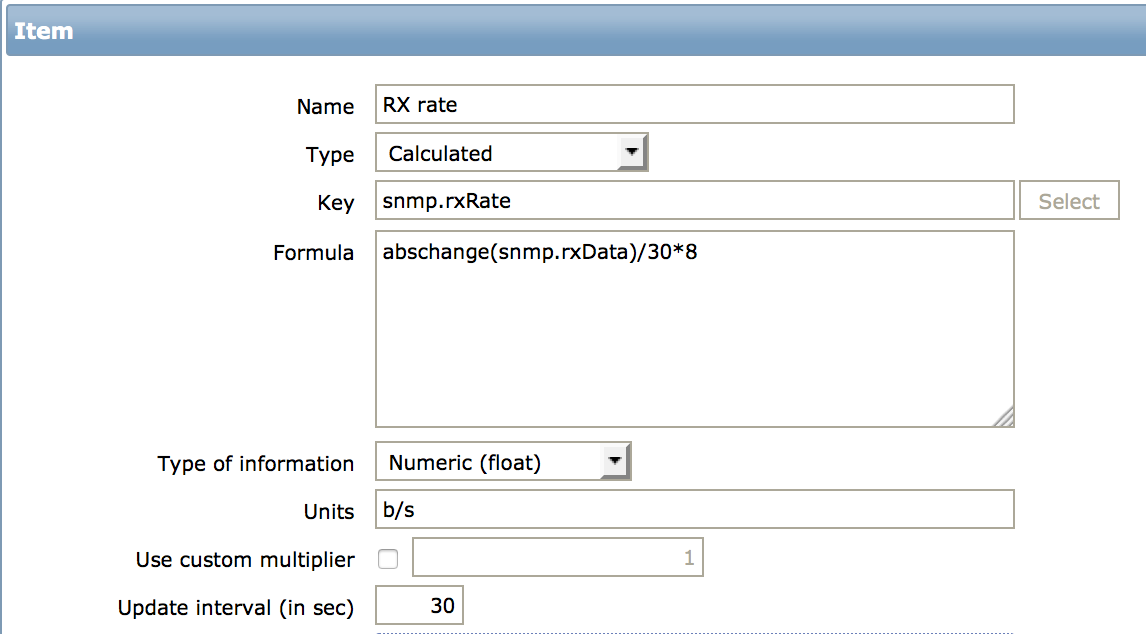
This is what the calculated Items look like. I have an update interval of 30 seconds so I divide the byte counter by 30. I then multiply by 8 to get a value in bits per second. This is useful because you can plot it on the same graph as reported TX and RX capacity. (This graph is included in the XML template linked above.)
To prepare your Host for the template you just need to add a macro like this:
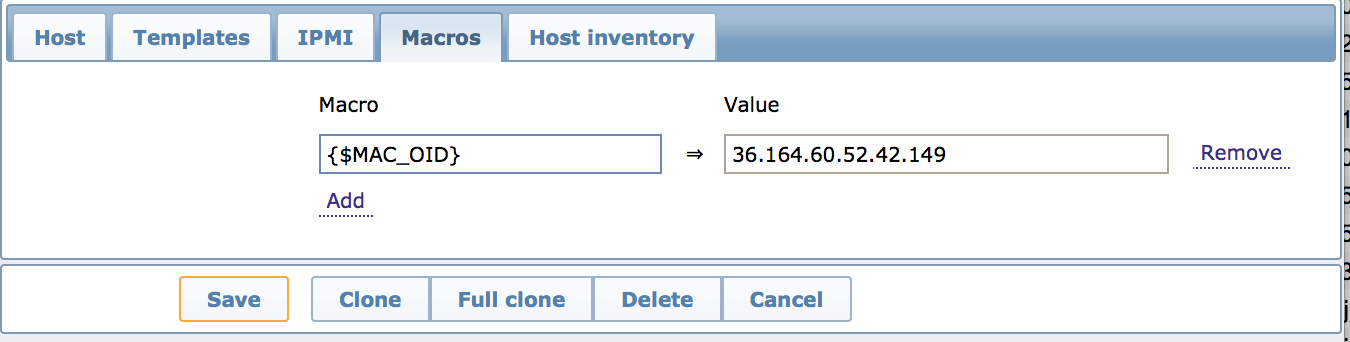
Then you can add your template and you’re in business.
It would be lovely to use Zabbix discovery and this is not out of the question. If you SSH to your Ubiquiti AP (who knew) the command wstalist spits out a neat JSON array with detailed information about all connected clients. It would be an interesting little project to make a translation layer that enables Zabbix to query that data—or perhaps insert data in the other direction so that the poor Ubiquiti isn’t being hammered by SSH connections.
Here’s an example of that output:
$ ssh 192.168.2.101 -l ubnt wstalist
[
{
    "mac": "24:A4:3C:34:2A:95",
    "name" : "NanoBridge M5",
    "lastip" : "10.130.1.130",
    "associd" : 1,
    "aprepeater" : 0,
    "tx" : 52,
    "rx" : 26,
    "signal" : -82,
    "ccq" : 98,
    "idle" : 5,
    "uptime" : 172892,
    "ack" : 38,
    "distance" : 2400,
    "txpower" : 22,
    "noisefloor" : -93,
    "airmax" : {
	"priority" : 0,
	"quality" : 0,
	"beam" : -1,
	"signal" : 0,
	"capacity" : 0 },
    "stats" : {
	"rx_data" : 995636,
	"rx_bytes" : 1448816552,
	"rx_pps" : 0,
	"tx_data" : 605474,
	"tx_bytes" : 40700451,
	"tx_pps" : 0 },
    "rates" : [ "MCS0", "MCS1", "MCS2", "MCS3", "MCS4", "MCS5", "MCS6", "MCS7", "MCS8", "MCS9", "MCS10", "MCS11", "MCS12", "MCS13", "MCS14", "MCS15" ],
    "signals" : [ 0, 0, 0, -85, -82, 0, 0, 0, 0, 0, 0, -80, 0, 0, 0, 0 ]
}
]